I was reading an article in today’s Seattle Times about a Metropolitan King County Council hearing on the Seattle arena proposal to build yet another sports arena in SoDo, when this bit stuck out to me:
[Councilmember Jane] Hague then wanted to know if the region could support so many teams. Counting the NBA and NHL, as well as the University of Washington football team playing in a new stadium, Councilmember Larry Phillips said the area could have seven major teams. He wondered if any other “midsized major market” supported that many.
“I think this area can support it,” [former Sonics coach Lenny] Wilkens said.
Phillips said he’d want to see a market analysis.
Traditionally the only kind of market analysis I do is for the Seattle real estate market, but once in a while I like to branch out, so I thought I’d give the Council a head start.
To get an idea of how reasonable it might be to have six professional sports teams here in the Seattle metro area, I took a list of the top 30 largest metro areas in the United States and counted up how many pro sports team each metro area currently has. For this analysis, I decided to exclude college sports and just focus on NFL, MLB, NBA, WNBA, NHL, and MLS. Las Vegas is the 30th-largest metro but has no pro sports teams so we’ll leave it off the chart. LA’s Inland Empire (Riverside & San Bernardino Counties, #12 on its own) doesn’t have any sports teams of its own, so I included its population with LA. I’ve also included the San Jose metro area population (#31) with the San Francisco population to better reflect the whole Bay Area.
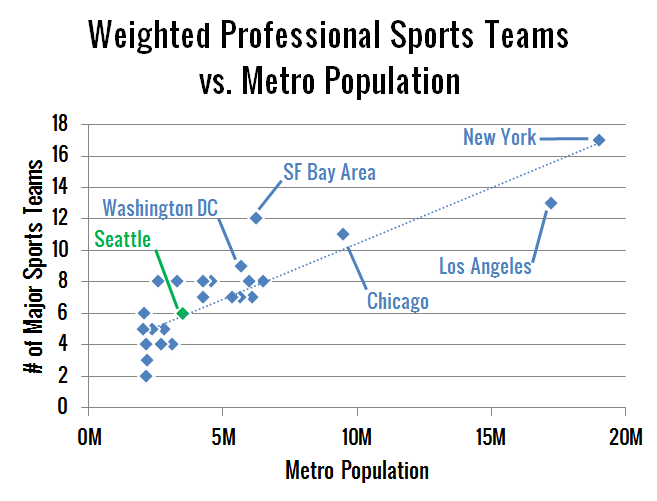
Here’s the resulting chart, showing where Seattle sits today with four teams (NFL, MLB, WNBA, and MLS):

As you can see, Seattle’s current collection of professional sports teams puts us slightly above the trendline of these 28 metro areas. If we were to add NBA and NHL teams to our roster, it would put us on par with Washington DC, a metro area with 63% more people than Seattle.
[Update: A friend of mine asked for a weighted version of the above chart, where the major sports (NFL, MLB, and NBA) count double. You can view that version here.]
Another informative way to look at this question is in terms of population per team. Here’s a table of that data, showing Seattle’s location with and without two extra teams:
Click on any column header to sort by that column.
| Metro |
Teams |
Population |
Pop. per Team |
| Denver |
5 |
2,599,504 |
519,901 |
| Seattle (proposed) |
6 |
3,500,026 |
583,338 |
| San Francisco Bay Area |
7 |
4,391,037 |
627,291 |
| Minneapolis |
5 |
3,318,486 |
663,697 |
| Kansas City |
3 |
2,052,676 |
684,225 |
| Cleveland |
3 |
2,068,283 |
689,428 |
| Pittsburgh |
3 |
2,359,746 |
786,582 |
| Phoenix |
5 |
4,262,236 |
852,447 |
| Seattle (today) |
4 |
3,500,026 |
875,007 |
| Boston |
5 |
4,591,112 |
918,222 |
| St. Louis |
3 |
2,817,355 |
939,118 |
| Tampa |
3 |
2,824,724 |
941,575 |
| Washington DC |
6 |
5,703,948 |
950,658 |
| Cincinnati |
2 |
2,138,038 |
1,069,019 |
| Detroit |
4 |
4,285,832 |
1,071,458 |
| San Antonio |
2 |
2,194,927 |
1,097,464 |
| Portland |
2 |
2,262,605 |
1,131,303 |
| Philadelphia |
5 |
5,992,414 |
1,198,483 |
| Dallas / Fort Worth |
5 |
6,526,548 |
1,305,310 |
| Atlanta |
4 |
5,359,205 |
1,339,801 |
| Chicago |
7 |
9,504,753 |
1,357,822 |
| Baltimore |
2 |
2,729,110 |
1,364,555 |
| Miami |
4 |
5,670,125 |
1,417,531 |
| Houston |
4 |
6,086,538 |
1,521,635 |
| San Diego |
2 |
3,140,069 |
1,570,035 |
| New York |
11 |
19,015,900 |
1,728,718 |
| Los Angeles + Inland Empire |
9 |
17,249,798 |
1,916,644 |
| Orlando |
1 |
2,171,360 |
2,171,360 |
| Sacramento |
1 |
2,176,235 |
2,176,235 |
At 875,007 residents per local pro sports team, Seattle is already 25% below the 28-city average of 1,174,483. If we were to bring both NBA and NHL teams to our market we would shoot to a full 50% below the average.
It would appear that the answer to Councilmember Hague’s question of whether Seattle can “support so many teams” would appear to be “probably not.”
As for Councilmember Phillips’s question of whether ‘any other “midsized major market”‘ supports six teams, the answer is no. Only five other markets currently have six or more professional sports teams:
- Washington DC – 6 teams, 63% more people than Seattle
- San Francisco – 7 teams, 79% more people than Seattle
- Chicago – 7 teams, 172% more people than Seattle
- Los Angeles – 9 teams, 393% more people than Seattle
- New York – 11 teams, 443% more people than Seattle
Not even close.
Obviously a more detailed analysis would take into account incomes, recreational spending patterns, and other factors. That said, we’re obviously not hurting for pro sports teams here in Seattle, relative to the size of our market. So why exactly do we need to spend $200 million in public funds to build a new stadium and bring two new pro sports teams to Seattle?
[Update: Whoa, 164 226 comments and counting on the Seattle Times piece linking to this post. People certainly have strong opinions on this subject!]
[Update 2: …and it’s been posted on the Seattle P-I as well.]
[Update 3]
There have been a number of comments on the Seattle Times piece as well as here on this post about the various other factors that need to be considered when attempting to answer the question of whether Seattle can support six pro sports teams.
Although I did plainly call out that this was just a cursory analysis meant to answer the specific “metro size” questions posed by the Councilmembers, I decided to get the latest Personal Income data from the Bureau of Economic Analysis to run a few additional numbers.
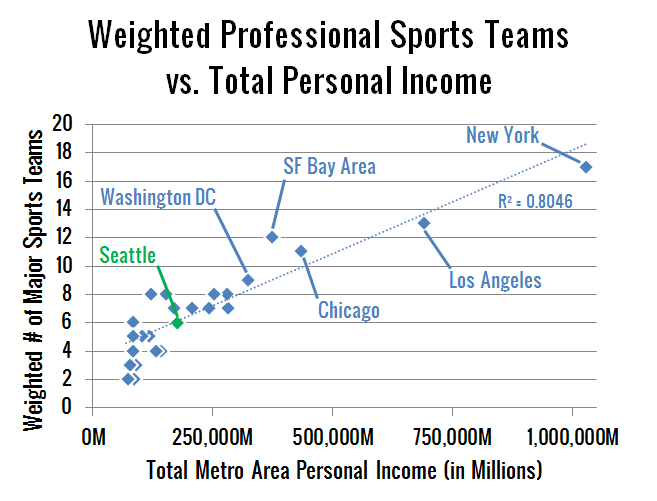
Here’s what the first chart looks like if you use Personal Income as the x-axis instead of population:

I made a weighted version of this one, too if you prefer that.
For the non-stats-nerds out there, the R² value on the chart is the coefficient of determination, which is basically a way of measuring how closely correlated two sets of values are. In this case, total Personal Income and number of sports teams are 82% correlated, which is pretty high, and sightly better than the 79% correlation between population and number of sports teams.
And as long as I’m posting an update with incomes, here’s the table version, looking at personal income per local pro sports team instead of population per sports team:
Click on any column header to sort by that column.
| Metro |
Teams |
$M Income |
$M per Team |
| Denver |
5 |
$121,902 |
$24,380 |
| Cleveland |
3 |
$84,854 |
$28,285 |
| Kansas City |
3 |
$85,217 |
$28,406 |
| Seattle (proposed) |
6 |
$176,085 |
$29,348 |
| Phoenix |
5 |
$152,810 |
$30,562 |
| Minneapolis |
5 |
$154,479 |
$30,896 |
| Pittsburgh |
3 |
$103,039 |
$34,346 |
| Tampa |
3 |
$105,596 |
$35,199 |
| St. Louis |
3 |
$117,421 |
$39,140 |
| San Antonio |
2 |
$78,416 |
$39,208 |
| Cincinnati |
2 |
$84,611 |
$42,306 |
| Detroit |
4 |
$170,618 |
$42,655 |
| Seattle (today) |
4 |
$176,085 |
$44,021 |
| Portland |
2 |
$90,654 |
$45,327 |
| Boston |
5 |
$253,463 |
$50,693 |
| Atlanta |
4 |
$208,107 |
$52,027 |
| San Francisco Bay Area |
7 |
$374,249 |
$53,464 |
| Washington DC |
6 |
$323,536 |
$53,923 |
| Dallas / Fort Worth |
5 |
$277,516 |
$55,503 |
| Philadelphia |
5 |
$281,517 |
$56,303 |
| Miami |
4 |
$242,278 |
$60,570 |
| Chicago |
7 |
$435,413 |
$62,202 |
| Baltimore |
2 |
$133,587 |
$66,794 |
| Houston |
4 |
$281,842 |
$70,461 |
| San Diego |
2 |
$143,109 |
$71,555 |
| Orlando |
1 |
$75,289 |
$75,289 |
| Los Angeles + Inland Empire |
9 |
$691,121 |
$76,791 |
| Sacramento |
1 |
$86,943 |
$86,943 |
| New York |
11 |
$1,028,140 |
$93,467 |
At $44,021M in Personal Income per local pro sports team, Seattle is currently 15% below the 28-city average of $51,811M. If we were to bring both NBA and NHL teams to our market we would be at 43% below the average.
Here’s how the five markets with six or more professional sports teams stack up against Seattle in terms of total Personal Income:
- Washington DC – 6 teams, 84% more income than Seattle
- San Francisco – 7 teams, 113% more income than Seattle
- Chicago – 7 teams, 147% more income than Seattle
- Los Angeles – 9 teams, 292% more income than Seattle
- New York – 11 teams, 484% more income than Seattle
It would appear that the answer comes out roughly the same when you factor incomes into the equation. Seattle still just doesn’t stack up with the metro areas that have six or more teams.
Lastly, it’s worth noting that I personally don’t really care whether Seattle gets a new stadium and two new teams. I’m neither a sports fan nor a sports hater. I’ve got no horse in this race, and nobody’s paying me to do this basic analysis. I just saw the Councilmembers quotes in the Seattle Times and thought it was an interesting question worth exploring.


